Health Tech
Last Updated
May 12, 2026
Table of contents
If you’ve ever stepped on a smart scale and watched it spit out your body fat percentage, muscle mass, and visceral fat score, you’ve probably wondered: how much of this can I actually trust? At OneTwenty.com, we field this question constantly from patients who use smart scales as part of their longevity monitoring. The short answer is nuanced — and understanding it can transform how you use these devices.
Quick Answer: How Accurate Are Smart Scales Overall?
Let’s cut straight to what matters. When it comes to total weight, quality smart scales are genuinely accurate. Most modern devices claim precision within ±0.1–0.2 kg (±0.2–0.4 lb), and research confirms this holds up well. Studies comparing consumer scales to clinical measurements show median weight errors of around 0.25 to 0.3 kg — essentially negligible for practical purposes.
Body composition measurements tell a different story. Body fat percentage, lean mass, bone mass, and visceral fat scores are estimates, not clinical diagnostics. In peer-reviewed comparisons with DEXA scans conducted between 2015 and 2024, many consumer body fat scales mis-estimate fat mass by 3–5 percentage points on average, with some individuals seeing errors of 7–8 percentage points. In absolute terms, fat mass and lean mass can each be off by 3–5 kg or more.
At OneTwenty.com, we treat smart scales as trend-tracking tools rather than sources of absolute truth. We combine daily or weekly smart scale data with quarterly lab panels — including markers like fasting insulin, triglycerides, and hs-CRP — and periodic gold standard body composition assessments when clinically indicated. The takeaway for users: focus on direction and consistency over time, not single-day precision. A steady downward slope in estimated body fat over three months matters far more than whether today’s reading says 24.3% or 26.1%.
What Exactly Is a Smart Scale?
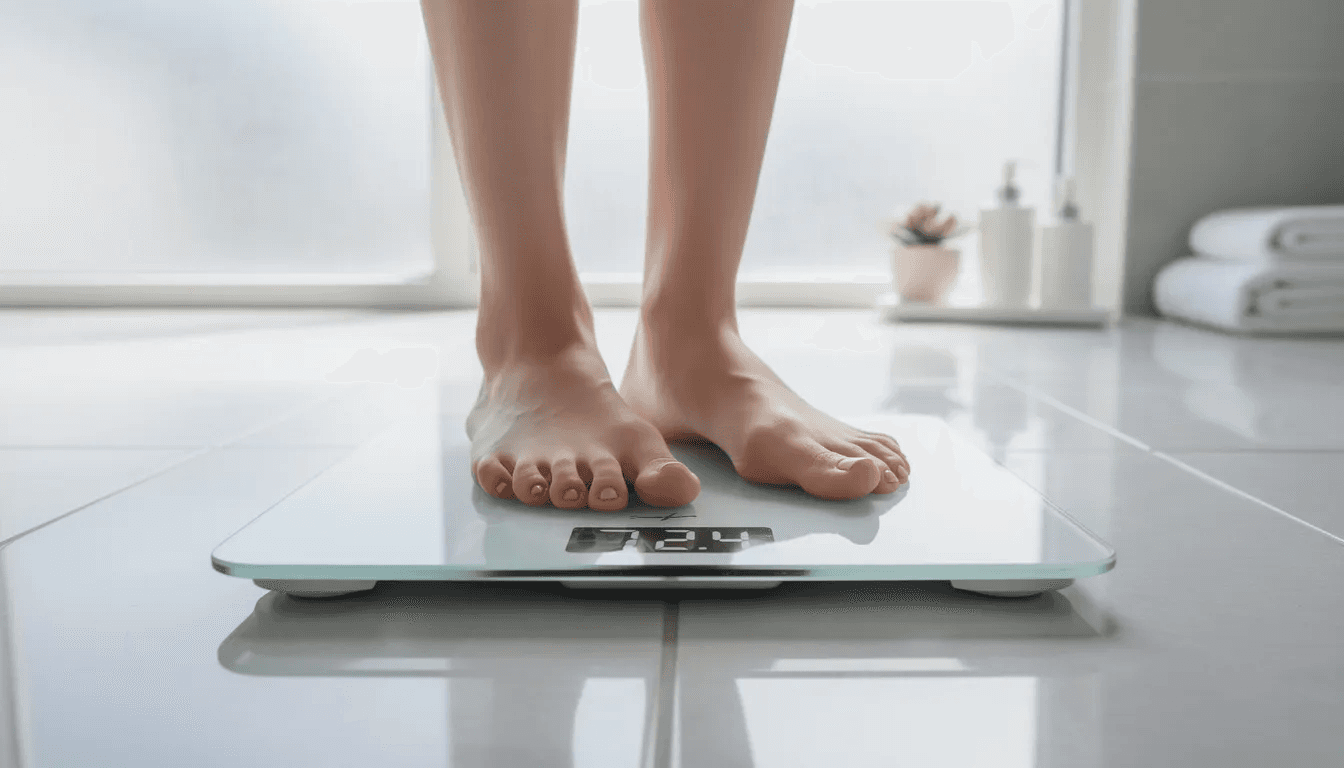
A smart scale extends beyond a basic digital scale by combining weight measurement with bioelectrical impedance analysis to estimate body composition. While a standard digital scale simply tells you how much you weigh, a smart scale attempts to break that overall weight into components.
Typical functions include:
Measuring body weight using high-sensitivity digital load cells
Estimating body fat percentage, fat mass, and lean mass
Calculating bone mass, total body water percentage, and basal metabolic rate
Providing a visceral fat score (an estimate of fat stored around internal organs)
Most devices connect via Bluetooth or Wi-Fi to smartphone apps, syncing seamlessly with platforms like Apple Health, Google Fit, or Fitbit. At OneTwenty.com, we ingest this data into our longevity dashboard for continuous monitoring alongside other health metrics.
Popular examples include devices from Withings, Garmin, Eufy, Fitbit, and RENPHO — all using similar underlying principles despite different branding and app ecosystems. It’s important to note that most smart scales are not FDA-cleared medical devices. They’re consumer electronics designed to estimate body composition, and their readings should be interpreted accordingly.
How Do Smart Scales Actually Work?
The technology behind smart scales sounds complex, but the core concept is straightforward: measure how easily a weak electrical current passes through your body, then use that data to estimate what you’re made of.
Bioelectrical Impedance Analysis (BIA)
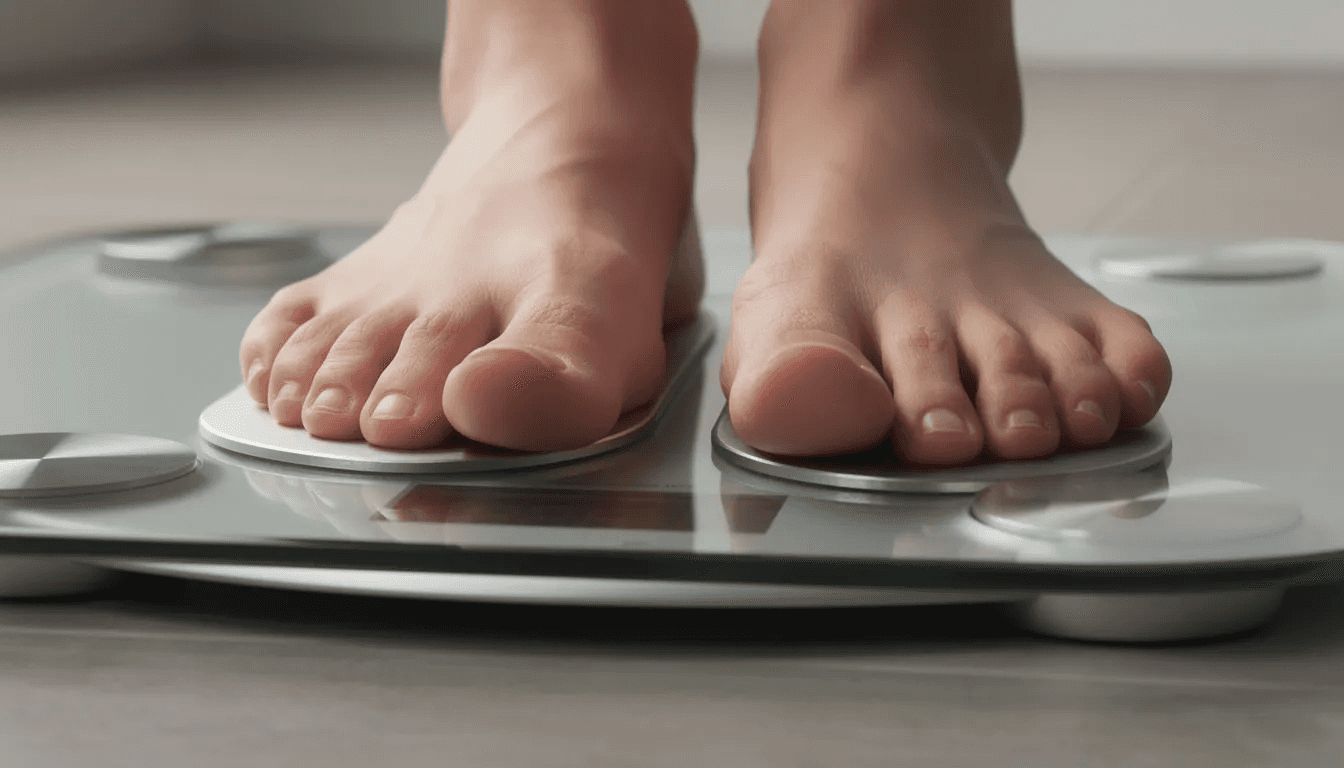
When you step on a smart scale, the metal electrodes under your feet send a very low, safe electrical current through your body. This current is painless — most people don’t feel anything at all.
Here’s the key principle: the electrical current travels more easily through water-rich tissues like muscle and organs, which have lower resistance. Fat tissue, which contains less water, is more resistive and slows the current down. By measuring this electrical impedance — essentially, how much the body resists the current — the scale gathers raw data about your tissue composition.
What the Scale Actually Measures
The device captures:
Electrical impedance (resistance, and sometimes reactance in advanced models)
Your input data: age, sex, height, and sometimes activity level or ethnicity
The scale’s proprietary algorithms then combine impedance readings with your weight and personal data to estimate body fat percentage, fat mass in kilograms, lean mass, total body water, and sometimes segmental values for different body regions.
Most home scales are foot-to-foot only, meaning they infer upper body composition from lower body measurements. This is a significant limitation, since your legs don’t perfectly represent your whole body.
Some higher-end models use multi-frequency BIA (sending currents at 5–500 kHz) to improve accuracy across different fluid compartments and tissue types. However, most companies don’t publish their full algorithms, which makes independent validation challenging and explains why different brands can give you noticeably different readings on the same day.
How Accurate Are Smart Scales for Weight vs. Body Composition?
Understanding the difference between “hard” and “soft” numbers is crucial. Weight is usually precise and repeatable. Body fat percentage and visceral fat scores are modeled estimates with meaningful margins of error.
Weight Accuracy
Modern smart scales deliver excellent weight accuracy. Most devices use strain-gauge load cells and claim precision within ±0.1–0.2 kg (±0.2–0.4 lb). You can verify this easily at home by placing a known weight — like a 10 kg dumbbell or 5 lb plate — on the scale and checking the reading.
Research confirms these claims. A 2021 cross-sectional study of consumer scales against clinical measurements found median weight errors of 0.25–0.3 kg, with interquartile ranges typically staying within half a kilogram. For tracking weight loss or weight gain over time, smart scales are reliable tools.
Body Fat Percentage and Lean Mass Accuracy
Body composition measurements are a different matter entirely. Studies from 2016–2023 comparing consumer BIA scales to DEXA found:
Metric | Average Error | Outlier Range |
|---|---|---|
Body fat percentage | 3–5 points | Up to 7–8 points |
Fat mass | 2.9–4.7 kg | Up to 6+ kg |
Lean mass | 3.9–4.5 kg | Up to 6+ kg |
The important insight: relative change is often more trustworthy than the absolute level. If your smart scale shows body fat percentage dropping from 29% to 25% over six months while you’re following a structured program, that trend likely reflects real progress — even if the “true” values are somewhat different.
Accuracy Differences by Body Type
Not everyone experiences the same error margins:
Athletes and muscular individuals are often read as leaner than they actually are, because their high muscle mass and hydration levels affect impedance readings
People with obesity may see larger errors due to how fat distribution affects current pathways
Those with edema or significant fluid shifts (kidney disease, heart failure, late-stage pregnancy) can have severely distorted readings
Very lean individuals approaching essential fat levels may also see increased measurement variability
The OneTwenty.com Perspective
We rarely react clinically to a single smart scale body fat reading. Instead, we:
Track multi-month trends in scale-estimated composition
Cross-check with lab markers (fasting insulin, triglycerides, liver enzymes, inflammatory markers)
Use DEXA or other imaging when precise measurement matters for clinical decisions
This layered approach lets us use smart scale data points for what they do well — daily feedback and trend tracking — without over-interpreting their limitations.
Key Factors That Affect Smart Scale Accuracy
Conditions of use often matter more than the brand itself for everyday users. Here’s what affects your readings and how to control for these other variables.
Hydration and Body Water
Hydration levels have an outsized impact on body composition readings. Since BIA measures how easily current flows through water-rich tissues:
Dehydration (after long flights, saunas, intense evening workouts, alcohol consumption) typically makes body fat percentage read higher — the scale mistakes lower water content for more fat
Over-hydration can make fat percentage read artificially lower
Solution: Measure at the same time each day, ideally in the morning after using the bathroom and before eating or drinking.
Recent Food, Alcohol, and Exercise
Several factors can distort readings for 12–24 hours:
Large meals change body water distribution
Alcohol affects hydration and glycogen stores
Heavy resistance training or long cardio sessions shift fluid and glycogen in muscles
Skip readings immediately after intense workouts or late-night drinking if you want consistent data.
Skin Temperature and Environment
Very cold feet or cold bathroom floors can slightly change impedance readings. Measure in a temperate indoor environment for best consistency. If your bathroom is freezing in winter, your readings may run slightly different than in summer.
Scale Placement and Posture
Proper setup matters:
Place the scale on a flat, rigid surface (not carpet)
Stand with bare, clean feet evenly placed on the electrodes
Avoid leaning on counters or holding onto objects
Stand still and don’t shift weight during measurement
User Profile Data
This is often overlooked. Incorrect age, sex, height, or athlete mode settings in the app can shift readings by multiple body fat percentage points. During OneTwenty.com onboarding, we verify that profile settings are accurate — a step that takes 30 seconds but can meaningfully improve data quality.
Device Quality and Algorithm Differences
Different brands and models have slightly different baselines because their proprietary algorithms are trained on different reference populations. If you care about long-term trends, avoid frequently switching scales. The same scale used consistently will give you better trend data than alternating between different devices, even if another scale might be “more accurate” in absolute terms.
How Smart Scales Compare to Other Body Composition Methods
Understanding the accuracy-convenience tradeoff helps you know when smart scales are enough and when other methods make sense.
DEXA (Dual-Energy X-Ray Absorptiometry)
DEXA scans are the clinical gold standard for whole-body composition and bone density. Using dual energy x ray absorptiometry, these scans provide highly accurate regional fat distribution data — distinguishing visceral fat from subcutaneous fat, for example.
Limitations:
Small radiation exposure (minimal, but still present)
Cost: typically $75–$250 per scan in 2024
Requires clinic access and appointment
At OneTwenty.com, we may recommend DEXA at baseline or annually for select patients where precise body composition tracking affects clinical decisions.
Hydrostatic Weighing and Bod Pod
Both are research-grade methods that estimate body density to calculate fat percentage:
Hydrostatic weighing involves underwater submersion
Air displacement plethysmography (Bod Pod) measures body volume using air displacement in a sealed chamber
Both are very accurate but require specialized facilities — not practical for routine home monitoring.
Skinfold Calipers
Calipers measure subcutaneous fat thickness at standardized sites (triceps, suprailiac, thigh, etc.). In expert hands, skinfold measurements can rival or beat consumer smart scales for accuracy. However, results depend heavily on operator training, and the method isn’t convenient for daily or weekly self-tracking.
Handheld BIA Devices
These work similarly to scales but run current from hand to hand, emphasizing upper body tissues. They often disagree with foot-to-foot scales because they’re capturing different segments. Neither is perfect — they’re simply measuring different things.
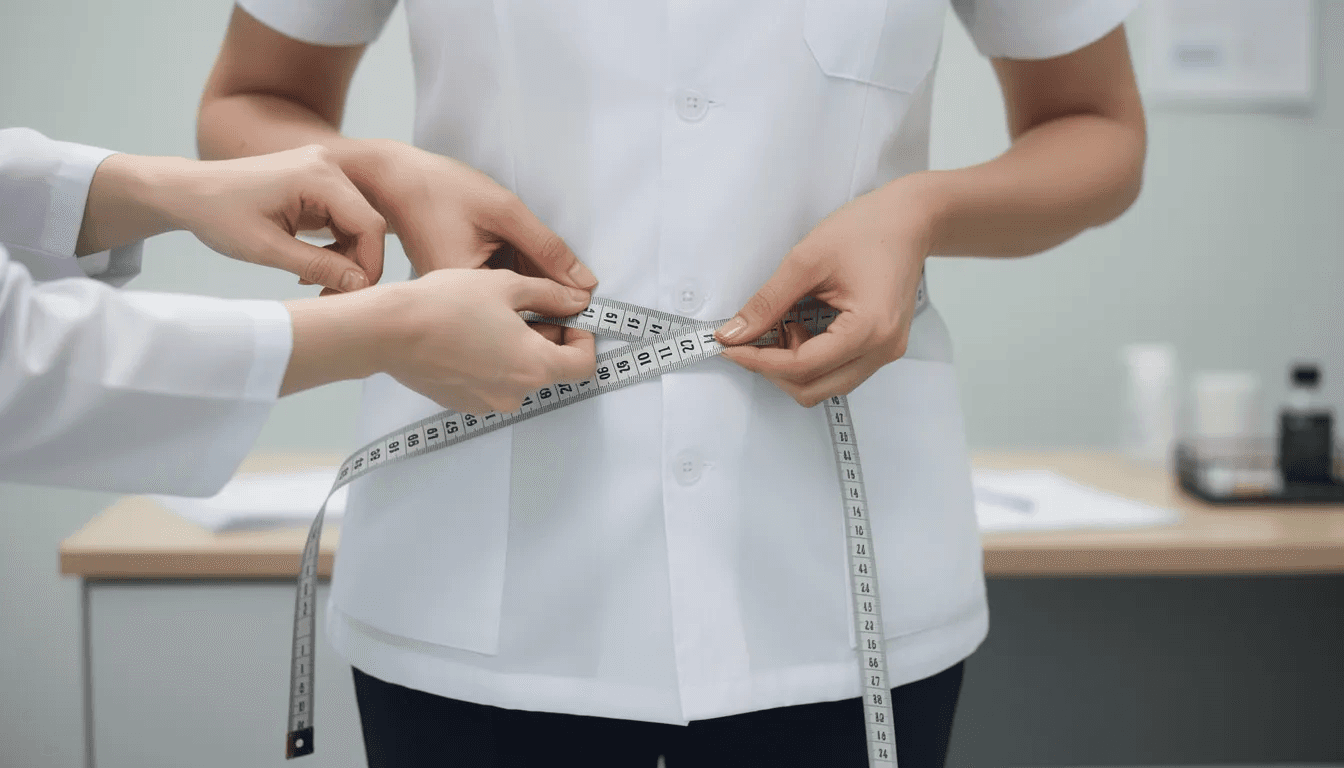
Waist and Waist-to-Height Measurements
A simple tape measure provides valuable data about central fat distribution. Waist circumference thresholds associated with elevated cardiometabolic risk:
Population | Higher Risk Threshold |
|---|---|
Many women | >88 cm (35 inches) |
Many men | >102 cm (40 inches) |
Note: Ethnicity-specific cutoffs may differ.
At OneTwenty.com, we pair smart scale trends with tape measurements and lab markers for a fuller picture of metabolic risk — a combination that captures more of the whole story than any single method alone.
Using Smart Scales the “Longevity Way”: Best Practices from OneTwenty.com
Here’s how we guide our patients to get maximum value from their smart scale data while avoiding common interpretation mistakes.
How Often to Measure
Engaged users: Daily or every-other-day weigh-ins work well
Minimum recommendation: At least weekly measurements
Key principle: We focus on 4–12 week averages rather than single readings
Daily data gives you more points to work with, smoothing out the noise from hydration fluctuations and other factors.
Standardized Routine
For consistent, comparable measurements:
Measure in the morning
After using the bathroom
Before food or drink
Same day(s) of week when possible
Bare feet, dry skin, no lotion or oil just before stepping on
This routine minimizes the important factors that cause day-to-day variability unrelated to actual body composition changes.
Data Integration at OneTwenty.com
We automatically pull smart scale data (where permissions allow) into user dashboards. Our clinicians and coaches review body composition trends alongside quarterly blood work, including:
Lipid panels (LDL, HDL, triglycerides, ApoB)
Glucose and insulin markers
Inflammatory markers (hs-CRP)
Thyroid and hormone panels
This integration lets us see whether scale trends correlate with metabolic improvements or if we need to investigate discrepancies.
How We Interpret Changes
Encouraging pattern: A slow, steady drop in scale-estimated fat percentage plus improved triglyceride/HDL ratio suggests real fat loss and metabolic improvement.
Artifact pattern: Sudden 2–3% jumps in body fat percentage over a few days, without lifestyle change, usually reflect hydration or measurement artifacts — not rapid fat gain. We don’t react to these; we wait for the trend to clarify.
Think of individual readings as “noisy signals.” The underlying trend — visible over weeks and months — is the true signal.
Safety and Specific Populations
Standard BIA smart scales are typically not recommended for:
People with implanted cardiac devices (pacemakers, ICDs) unless their cardiologist explicitly approves, since the electrical current could theoretically interfere with device function
Pregnant women in late pregnancy, since fluid shifts and body changes distort readings and research is limited
For these populations, OneTwenty.com emphasizes weight tracking, circumference measurements, and lab markers instead of BIA-based body composition estimates.
Setting Expectations
We encourage patients to see smart scale data as a personal “signal” rather than a pass/fail grade. The measure that matters for longevity isn’t hitting a specific target body fat percentage — it’s seeing a long-term slope in the right direction: improving overall body composition, maintaining or building muscle mass, and reducing metabolic risk factors.

Do Smart Scales Really Help You Live Longer and Healthier?
All this discussion of accuracy ultimately serves a bigger question: does tracking body composition actually matter for healthspan and lifespan?
Why Body Composition Matters for Longevity
Research shows that body composition — not just overall weight or body mass index — predicts long-term health outcomes:
Higher visceral fat is linked to type 2 diabetes, cardiovascular disease, fatty liver disease, and certain cancers
Maintaining muscle mass into your 60s, 70s, and 80s strongly predicts independence, falls risk, and all-cause mortality
The fat to muscle ratio appears more predictive of metabolic health than total body weight alone
Simply tracking whether you lose weight doesn’t tell you whether you’re losing fat or muscle. Body composition scales, despite their limitations, at least attempt to answer this more nuanced question.
Role in Behavior Change
Daily or weekly feedback can reinforce a healthy lifestyle and make progress visible, even when the mirror or clothes don’t change quickly. At OneTwenty.com, we use scale trends to personalize:
Nutrition recommendations (protein targets, caloric adjustments)
Training volume and resistance exercise programming
Recovery protocols and sleep optimization
Seeing your estimated lean mass hold steady or increase while fat mass decreases provides motivation that “weight loss” alone cannot match. It helps users understand they’re not just getting lighter — they’re improving their overall body composition.
Connecting Scale Data and Labs
Quarterly lab panels allow us to verify whether improved scale metrics translate into better metabolic health:
Scale Trend | Expected Lab Correlation |
|---|---|
Lower estimated body fat | Lower fasting glucose, improved HbA1c |
Maintained lean mass | Stable or improved kidney function markers |
Reduced visceral fat score | Lower liver enzymes (ALT, AST), improved lipids |
If smart scale readings look “good” but labs worsen, we adjust strategy and may confirm with DEXA, ultrasound, or other imaging. The combination of continuous scale data and periodic lab validation creates a feedback loop that neither approach provides alone.
The Bottom Line
Smart scales are not perfect devices for measuring body fat. Their body fat measurement capabilities have real limitations — errors of several percentage points are common, and certain populations will see larger discrepancies. They cannot replace DEXA scans or other clinical methods when precision matters.
But when used correctly — with consistent technique, standardized timing, and proper interpretation — smart scales accurate enough to track meaningful trends over time. Combined with quarterly lab panels and clinical oversight, they become powerful tools for long-term weight management and metabolic health monitoring.
At OneTwenty.com, our goal isn’t to help you hit a perfect body fat percentage on a given Tuesday morning. It’s to use continuous data to help you add high-quality, functional years to your life. Smart scales, interpreted thoughtfully, are one valuable piece of that puzzle — giving you feedback that helps you estimate body composition trends and adjust your approach as you work to lose body fat, maintain muscle, and optimize your overall health for the decades ahead.


Lifelong Optimization
Not your average
Checkup
Every life stage brings new biological demands. Tracking the right metrics at the right time helps you adapt, optimize performance, and extend both lifespan and healthspan.
Traditional
Manual Data Processing
Guesswork Trend Detection
Slow Campaign Setup
Multiple Tools, Multiple Logins
Reactive Decision-Making
Manual Reporting
Delayed Results
High Error Risk
Automated Data Sync
Real-Time Trend Insights
Instant AI Optimization
All-in-One Platform
Proactive AI-Driven Strategies
Auto-Generated Reports
Instant Performance Updates
AI Precision
Frequently Asked Qustions
Clarity before you commit
Answers on setup, scale, and support to remove blockers.


What’s included in the membership?
Do you accept HSA and FSA?
Do I have to take medications?
Is OneTwenty available in my state/country?
Is it safe & secure (HIPAA)?